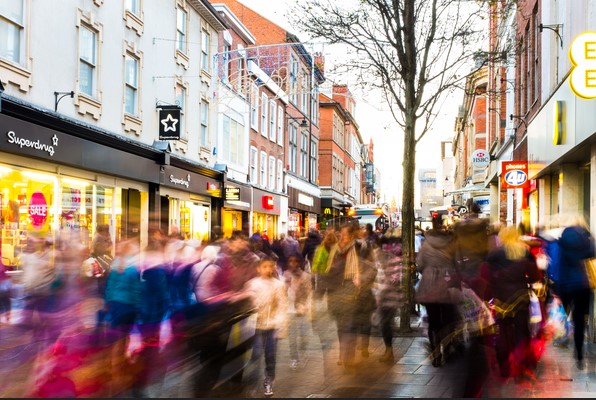
Interactive footfall report comparing
Q2 & Q3 2022 and Q3 2021
This report focuses on the 3rd Quarter of 2022. Exploring the months July through to, and including, September.
Comparisons will be explored between the previous quarter of 2022 to discover trends along with the same quarter from the previous year.
As the UK now faces not only the challenge of dealing with a changed way of work life post pandemic, but also the cost-of-living crisis, inflation and potential recession that has recently been warned. It is extremely important to understand how this has impacted footfall.
Both cities and towns will be explored, along with more specific categories such as High Streets, Markets and Coastal/Seafront regions.
The report will show the drop in footfall that has continued throughout the year with the 3rd Quarter footfall lower than the 2nd Quarter figures and significantly lower than in the same period last year.
While footfall has dropped, dwell time has increased as a result. This is an expected and consistent effect that happens when footfall drops. Sunday has consistently been the highest dwelling day. Essentially this means that while less individuals are entering our Cities and Towns, those that do are there because they feel they need to be and are therefore staying for a longer period.
To access the interactive report please use the link below